
Climate change is not simply making deserts “more desert.” That sounds neat, but it misses what is really happening. In many dry regions, heat is rising, evaporation demand is climbing, rainfall is becoming harder to predict, and the sharpest stress often appears along desert margins rather than in the empty core of a dune field. Some places dry out year after year. Others swing between long dry spells and short, violent downpours. Both patterns can damage desert systems.
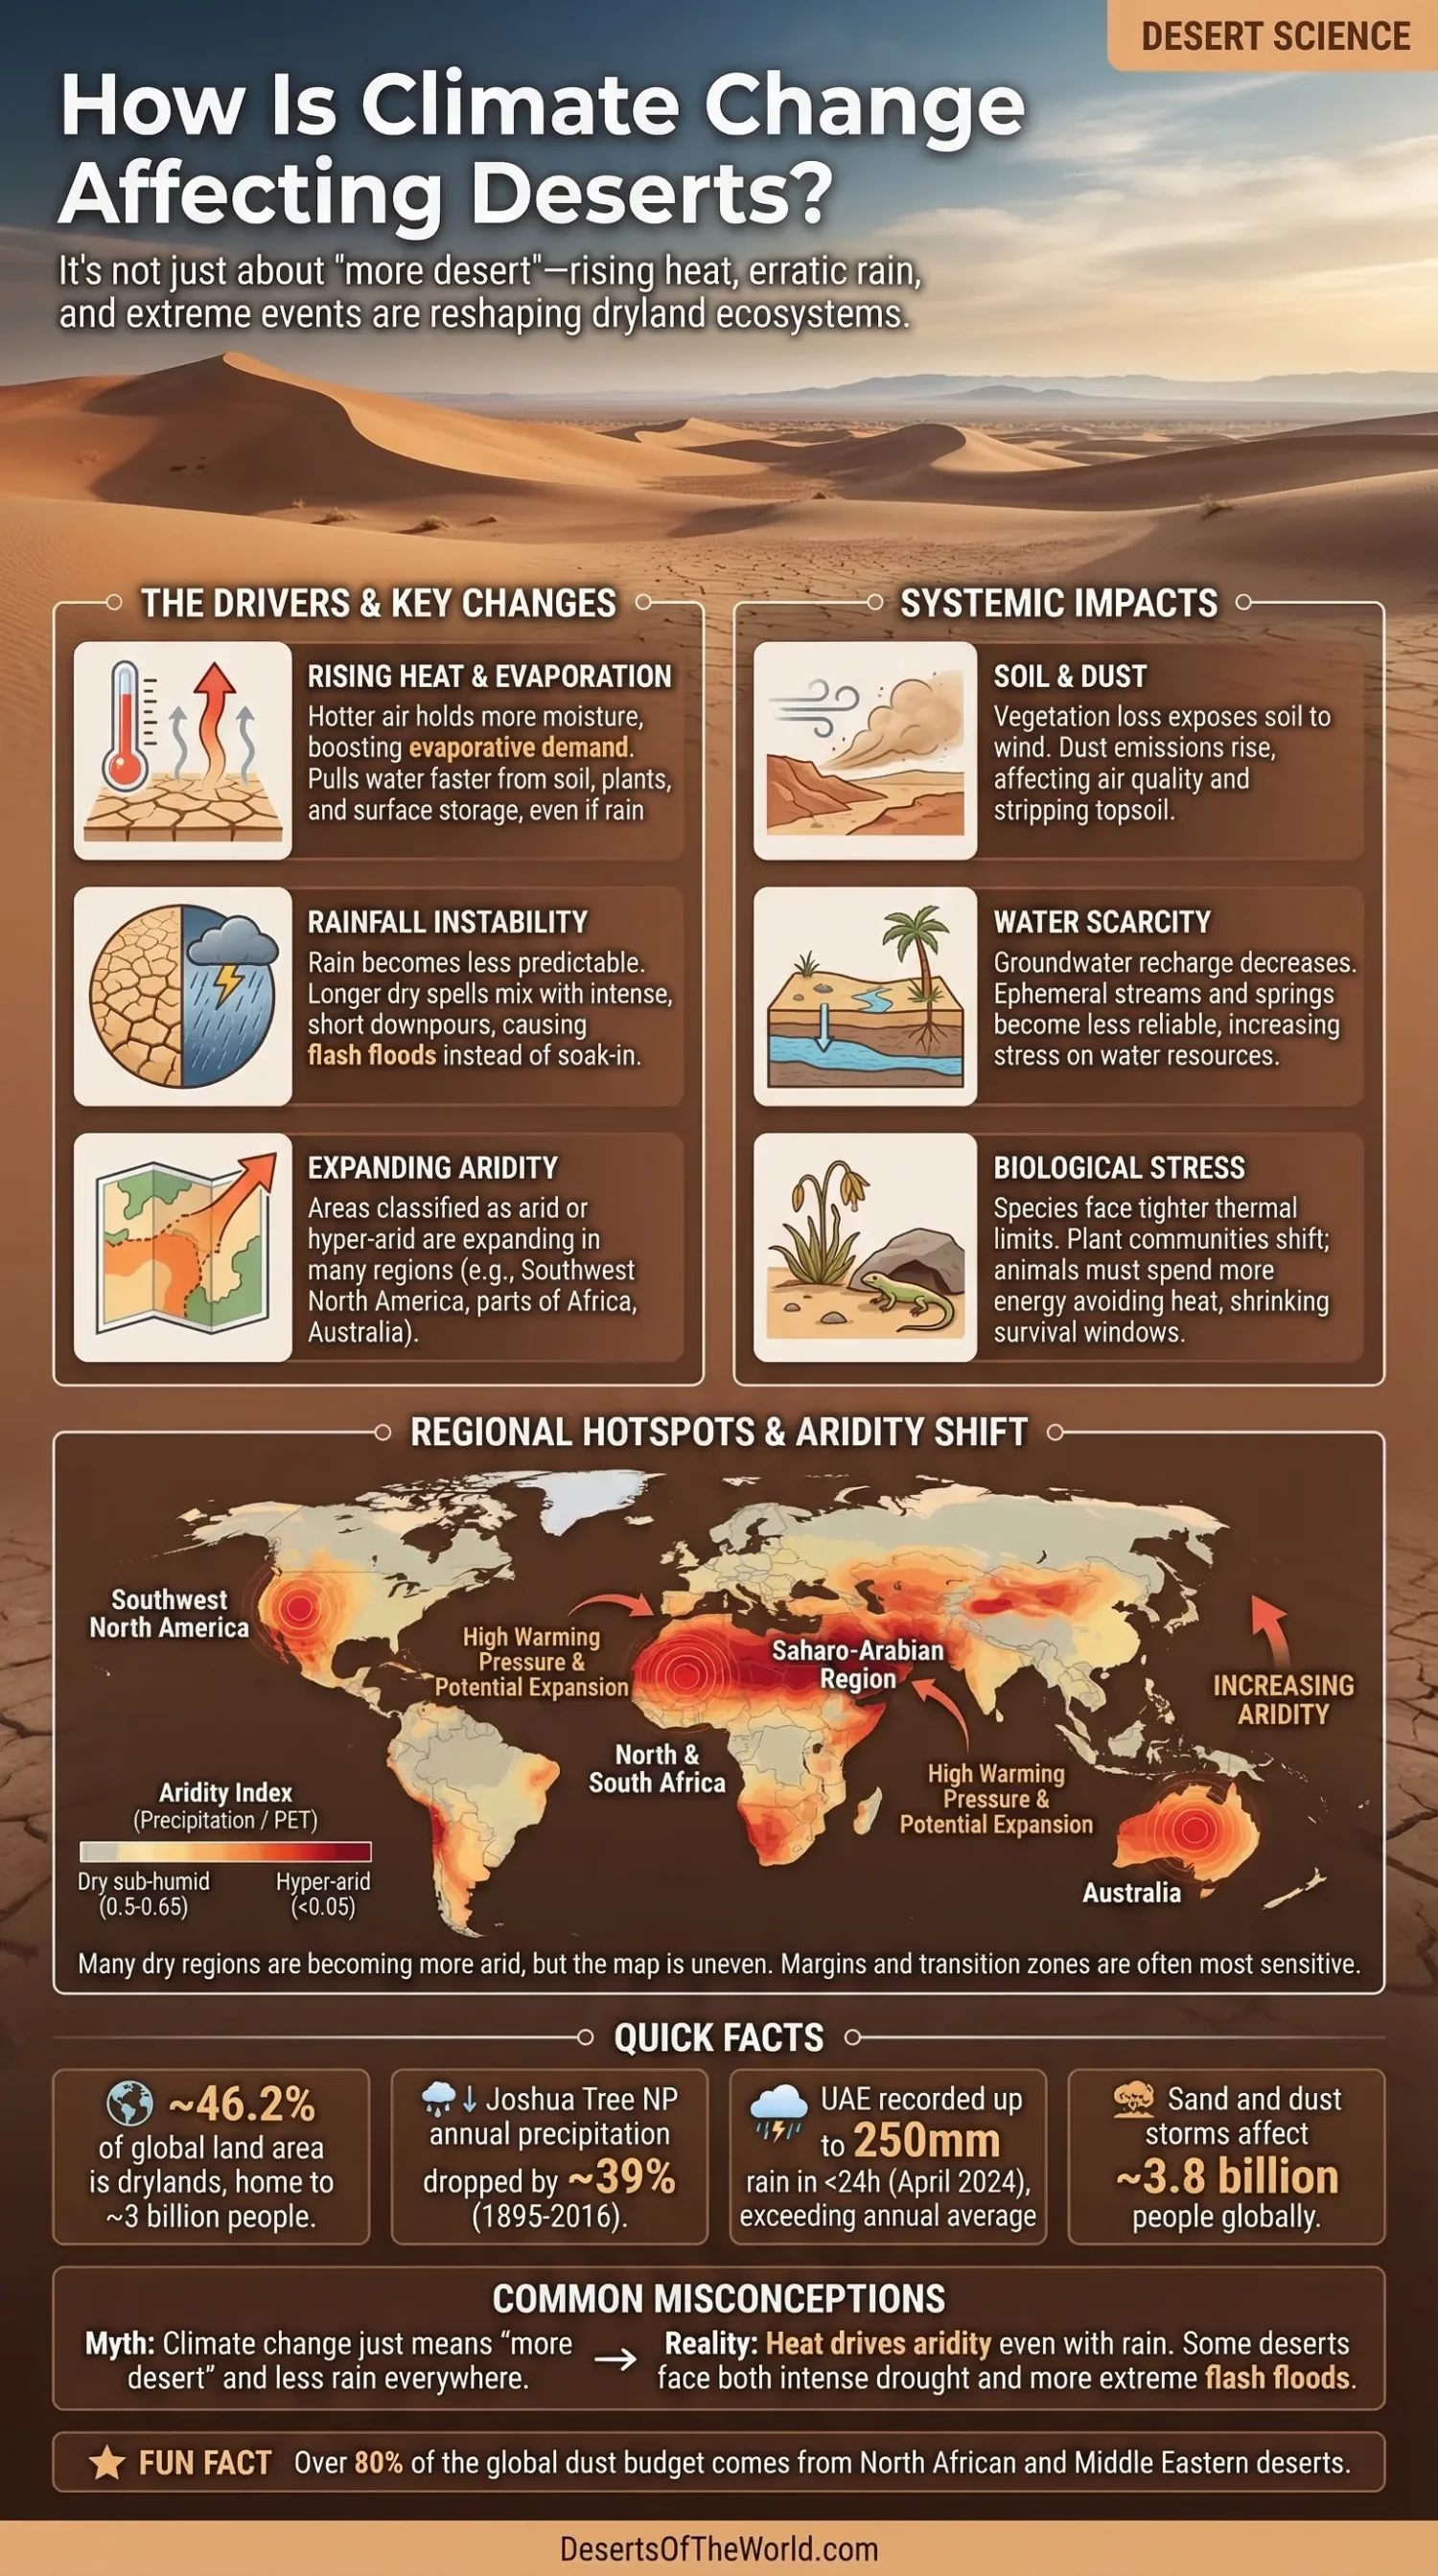
That matters because drylands already cover a very large share of Earth’s land surface and support hundreds of millions of livelihoods tied to grazing, farming, groundwater, wadis, oases, and seasonal vegetation. The current shift goes beyond scenery. It changes soil moisture, surface water, dust movement, plant cover, and the thermal limits of desert wildlife.
| Climate Signal | What Is Changing in Deserts | Why It Matters |
|---|---|---|
| Higher Air Temperature | Hotter air raises potential evapotranspiration, dries soils faster, and lengthens heat stress periods | Plants lose water faster, streams shrink sooner, and animals spend more energy avoiding heat |
| Rainfall Instability | Rain comes less reliably in many dry regions, with longer gaps between events | Seed germination, grazing cycles, and groundwater recharge become less dependable |
| Heavier Short Rain Events | Some deserts now receive rare but intense storms | Flash floods, erosion, and infrastructure damage can rise even where annual rainfall stays low |
| More Bare Ground | Vegetation loss leaves soil exposed to wind and water erosion | Dust emissions rise, topsoil thins, and local air quality worsens |
| Biological Stress | Species living near heat and water limits face tighter survival windows | Plant communities shift, seedling survival drops, and some animals lose usable habitat |
Why Deserts React So Fast
Deserts work on thin margins. A small change in rain, soil moisture, humidity, or wind can reshape the whole system. In a humid forest, a dry month may leave a mark. In a desert, the same shift can alter an entire season of growth. Drylands are therefore highly sensitive to warming.
The Aridity Math Behind Desert Change
Scientists often measure dryness with the Aridity Index, written as precipitation divided by potential evapotranspiration. In simple terms, it compares incoming water with the atmosphere’s drying demand. Drylands are usually classified where this ratio is below 0.65. Within that range, the standard classes move from dry sub-humid to semi-arid, arid, and hyper-arid.
A place can receive similar rain as before and still become more arid if heat drives up evaporation. Rainfall amount alone does not capture the change; the rate at which heat pulls water from soil, plants, and shallow surface storage also matters.
IPCC assessments place drylands at about 46.2% of global land area, home to roughly 3 billion people. A more recent UNCCD assessment found that 77.6% of Earth’s land experienced drier conditions over the three decades leading to 2020, and drylands expanded by about 4.3 million km². Those numbers show the scale of the shift plainly.
Not Every Desert Moves in the Same Direction
Climate change does not push every desert in one identical way. The IPCC notes that global dryland area could expand by about 10% by 2100 under a high-emissions pathway, yet the pattern is regional. Expansion is expected in places such as southwest North America, parts of northern and southern Africa, and Australia. Some other zones may see weaker drying or even local contraction of dryland boundaries.
Many dry regions are becoming more arid, but the map is uneven. Desert cores, foothills, coastal belts, and semi-arid transition zones do not react in the same rhythm.
Main Ways Climate Change Is Changing Deserts
Hotter Air Pulls More Moisture From Soil and Plants
The first and most direct effect is heat. As temperatures rise, the air can hold more moisture, which boosts evaporative demand. Even where rainfall totals do not collapse, hotter air can still lower soil moisture, shorten the life of seasonal pools, and reduce how long plants remain active after rain.
Desert stress is often visible in seedlings before it becomes visible in old shrubs or mature trees. Young plants have shallow roots and narrow survival windows. Once those windows close, plant recruitment weakens. The landscape may still look green after a good year, while the long-term replacement cycle begins to fail.
Rainfall Becomes Less Reliable
Many deserts depend less on total annual rainfall than on timing. A place may receive a similar yearly amount, yet if the rain comes later, arrives in fewer bursts, or misses the cool season, the ecological outcome changes. Germination, flowering, forage growth, and groundwater recharge all depend on timing.
Dryland change is often felt first as unreliability. One year looks generous. The next two fail. Then a single storm drops a large amount in hours, when the soil cannot absorb much of it. The rainfall signal can look irregular even while long-term aridity grows.
El Niño Is Strengthening Into 2027
The World Meteorological Organization reports that El Niño is firmly established in the tropical Pacific and is expected to strengthen into a very strong event, with a nearly 100% likelihood of persisting through February 2027. Forecasts indicate that it is likely to peak toward the end of 2026.
El Niño can shift rainfall and temperature patterns across wide regions, so desert and semi-arid areas may face altered drought, heat, or heavy-rain risks depending on location. These seasonal effects can intensify or interrupt local dry spells without, by themselves, reversing the longer-term aridity trends affecting many drylands.
Heavy Downpours and Flash Floods Grow More Disruptive
Desert climate change can include stronger dryness and intense rain events within the same region. A hotter atmosphere can hold more water vapor, allowing some storms to release large amounts of rain over short periods. A desert may therefore experience drought and flash flood within the same decade or even the same season.
The Arabian Peninsula offered a clear example in April 2024. Parts of the United Arab Emirates recorded up to 250 millimeters of rain in less than 24 hours, even though the country usually receives only about 140 to 200 millimeters in a full year.
For deserts, these downpours often provide little lasting relief. Hard, dry soils can seal quickly. Water runs across wadis, washes, alluvial fans, and urban surfaces at high speed. The result may be erosion, debris flows, gullying, and sediment movement rather than slow recharge.
Dust and Bare Soil Spread Faster
When plant cover thins, wind gains access to the soil surface. Then dust rises more easily. The World Meteorological Organization notes that sand and dust storms affect 3.8 billion people worldwide, with roughly 2,000 million tons of dust emitted every year. More than 80% of the global dust budget comes from North African and Middle Eastern deserts.
Dust affects health, roads, airports, solar energy, crops, and distant ecosystems. It can travel across oceans. In drylands, less vegetation and drier surface conditions often mean more exposed sediment, raising the chance of dust emission when winds strengthen.
Around 25% of global dust emissions are linked to human-related activity. Climate conditions and land use can therefore reinforce each other where vegetation removal or soil disturbance leaves dry surfaces more exposed to wind.
Desert Dust and Longwave Radiative Heating
Mineral dust also changes Earth’s energy balance after it enters the atmosphere. Dust interacts with incoming shortwave sunlight and with outgoing longwave infrared radiation from the surface and atmosphere. These effects can work in opposite directions, so dust cannot be treated as a simple warming agent.
A study published in Nature Communications on 28 April 2026 used a data-driven analytical model constrained by observations to estimate the global annual mean longwave direct radiative effect of desert dust at the top of the atmosphere. The result was +0.25 ± 0.06 W/m² at 90% confidence. A compilation of climate-model results produced a median of about +0.13 W/m², with a reported range of 0.09–0.23 W/m².
The researchers traced much of the gap to two model limitations. Most global models omit longwave scattering by dust, which the study found produces more than half of the global mean longwave effect. Many models also underestimate or omit super-coarse dust particles larger than 10 μm. Coarse and super-coarse particles account for much of the dust interaction with thermal infrared radiation.
The +0.25 W/m² estimate refers to the longwave heating component. It does not show that desert dust warms Earth overall. Dust also produces shortwave cooling by changing how solar radiation is scattered and absorbed, and the study states that the global sign and size of the combined shortwave-plus-longwave direct radiative effect remain uncertain. Longwave heating tends to be stronger near major dust-source regions, while shortwave cooling can be stronger over oceans and other darker surfaces downwind.
Plants and Animals Get Pushed Past Their Limits
Desert species are often described as well adapted to heat, and they are. Adaptation still has limits. Many species already live close to their water and temperature thresholds, and extra warming narrows the safe range.
Research on desert birds shows that warm deserts are expected to face disproportionately large temperature rises, and that physiological stress does not always line up neatly with the hottest air maps. Microclimate matters. Shade, exposure, coastal influence, rocky shelter, and access to water can change survival odds over very short distances. One result from global work on desert bird refugia found that less than 20% of those lower-impact refuges fall inside existing protected areas.
Plant communities also shift in uneven ways. In the Sonoran Desert, field studies show that species once seen as very drought-tolerant are declining in some locations, while shorter shrubs able to use sporadic rainfall spread into their place. Vegetation can change form, height, density, rooting depth, and seasonality before broad losses become obvious.
Which Desert Regions Are Under The Most Pressure
Desert Margins and Semi-Arid Belts
The most sensitive zones are often the edges: the steppe outside the dune sea, the scrub belt below a mountain front, the farming and grazing lands beside true desert. These places hold more people, more wells, more crops, and more fragile vegetation cover. They sit where a modest shift in heat and moisture can move the climate balance from strained to unstable.
Desertification risk often rises in transitional lands around the barest desert cores. When those belts lose vegetation, they can move from patchy cover to exposed soil quickly, and recovery is slow.
Southwest North America
The American Southwest shows this clearly. NOAA warns that continued warming lowers soil moisture and reduces the amount of water flowing into rivers and reservoirs used by about 60 million people. Across the Mojave and Sonoran systems, long periods of higher heat combined with water deficit place added pressure on vegetation and water supplies.
Joshua Tree National Park offers one of the clearest measured examples. From 1895 to 2016, annual precipitation there dropped by 39% and average temperature rose by 3°F (2°C). Under a high-emissions scenario, average annual temperature inside the park could rise by about 8°F (5°C) by 2099. Research cited by the park suggests that nearly all suitable habitat for Joshua trees inside the park could disappear under that pathway, with habitat across the broader Southwest cut by about 90%.
Saharo-Arabian Regions
The Saharo-Arabian realm is one of the clearest global hotspots for desert heat stress. Modeling work on desert birds points to especially strong shifts there in air temperature and evaporative water loss. Local outcomes still vary with coastlines, elevation, substrate, and occasional storm tracks across the Sahara and Arabian Desert.
Coastal and Fog-Linked Deserts
Some deserts depend on tiny water inputs that are easy to miss: fog drip, dew, short cool-season showers, and brief cloud cover that lowers heat load. In those places, even a small change in wind, humidity, or near-coast temperature can matter. A desert may still look dry to the eye while the moisture source that supports its lichens, insects, shrubs, or endemic plants becomes less dependable.
What Happens To Water, Soil, and Life
Water Becomes Harder To Store
Desert water stress depends on both quantity and timing. Longer dry periods reduce steady recharge. Hotter air strips moisture faster. Intense storms can then send water away before it soaks in. That combination makes springs, shallow aquifers, ephemeral streams, and small reservoirs less stable through time.
Groundwater pressure often rises next. When surface water grows less dependable, people pump more. In dry basins, that can worsen salinity, lower water tables, and place more stress on oasis farming and riparian strips.
Soil Structure Weakens
Desert soils look simple from a distance. Many rely on thin crusts, sparse root networks, and rare pulses of organic matter. Repeated heat, bare ground, and harder rainfall can break soil aggregates apart, strip fine particles, and deepen gullies. Once topsoil goes, recovery is slow.
Biological soil crusts matter here too. These communities of cyanobacteria, lichens, mosses, and fungi help stabilize surface soil and influence infiltration. When they are damaged by heat stress, trampling, erosion, or long dry periods, the land loses part of its natural surface protection.
Wildlife Must Spend More Energy Just To Cope
Heat changes animal behavior as well as water availability. Birds seek shade earlier. Mammals shift activity deeper into the night. Reptiles alter basking time. Pollinators shorten foraging windows. Every one of those adjustments carries costs in energy, breeding success, feeding time, or movement.
Climate stress in deserts can therefore appear first through behavioral changes. Animals may remain present while using less of the landscape, for shorter periods, and within tighter thermal limits.
A Common Misunderstanding About Desert Change
Desert change does not always mean wider sand seas, and a wetter spell does not automatically mean long-term recovery. A desert can receive a strong storm, bloom for a season, and still experience rising long-term aridity if background heat and evaporative demand continue to increase.
Rainfall and aridity are different measurements. A hotter climate can make water leave faster than it arrives. Scientists therefore track precipitation together with potential evapotranspiration, soil moisture, runoff, groundwater, vegetation cover, and dust output.
What Scientists Watch To Measure Desert Change
To understand whether a desert is shifting, researchers usually watch a set of linked indicators rather than a single number:
- Aridity Index (AI) — precipitation divided by potential evapotranspiration
- Potential Evapotranspiration (PET) — the atmosphere’s drying demand
- Soil Moisture — how much water remains available near the surface and root zone
- Vegetation Cover — often tracked by satellite using greenness signals
- Dust Emissions — a clue to exposed and unstable surfaces
- Runoff and Flash Flood Frequency — especially in wadis and built desert corridors
- Habitat Suitability — whether plants and animals still find usable microclimates
Desert change develops through linked shifts in heat, wind, water timing, soil texture, slope, and biology, so several measurements are needed to understand the direction of change.
Why Desert Edges Matter More Than People Think
The familiar image of a desert is often an empty dune field. Many climate-sensitive areas lie around its margins: rangelands, dry farms, scattered shrublands, floodplain edges, mountain piedmonts, and oasis networks. These areas carry more human use and ecological complexity, so a moderate climate shift can affect a larger range of land uses and habitats.
Warming, grazing pressure, groundwater demand, bare soil, and erratic rainfall can overlap in these transition zones. Repeated dry periods can then contribute to land degradation, weaker plant recovery, greater dust exposure, and sharper water stress.
Sources
- IPCC AR6 Cross-Chapter Paper 3: Deserts, Semiarid Areas and Desertification (projected dryland expansion, regional patterns, aridity science)
- IPCC Special Report on Climate Change and Land, Chapter 3 (drylands, desertification, land degradation, human exposure)
- NASA Science: The Effects of Climate Change (heat, drought, wildfire, extreme rainfall trends)
- NASA Earth Observatory: Deluge in the United Arab Emirates (April 2024 extreme rainfall in a desert climate)
- World Meteorological Organization: Sand and Dust Storms (dust emissions, exposure, climate links)
- Nature Communications: Desert Dust Exerts Twice the Longwave Radiative Heating Estimated by Climate Models (2026 longwave radiative effect, longwave scattering, super-coarse dust, and shortwave-cooling uncertainty)
- NOAA Drought.gov: Exceptional Southwest Drought Exacerbated by Human-Caused Warming (soil moisture decline, water supply pressure in the U.S. Southwest)
- U.S. National Park Service: Climate Change in Joshua Tree (measured warming, falling precipitation, habitat loss risk)
- University of California, Riverside: Even Sonoran Desert Plants Aren’t Immune to Climate Change (plant community shifts in the Sonoran Desert)
- Nature Communications: Global Patterns of Climate Change Impacts on Desert Bird Communities (thermal stress, refugia, protected-area gap)
- UNCCD: The Global Threat of Drying Lands (recent aridity trends and global drying patterns)
- World Meteorological Organization: El Niño/La Niña Update (2026 El Niño strength, persistence outlook, and expected rainfall and temperature shifts)